


A top-like TUI for bcachefs filesystems. Real-time per-device IO, latency, and internal stats with built-in tuning advisor.
Built for NASty but works on any system with a mounted bcachefs filesystem.
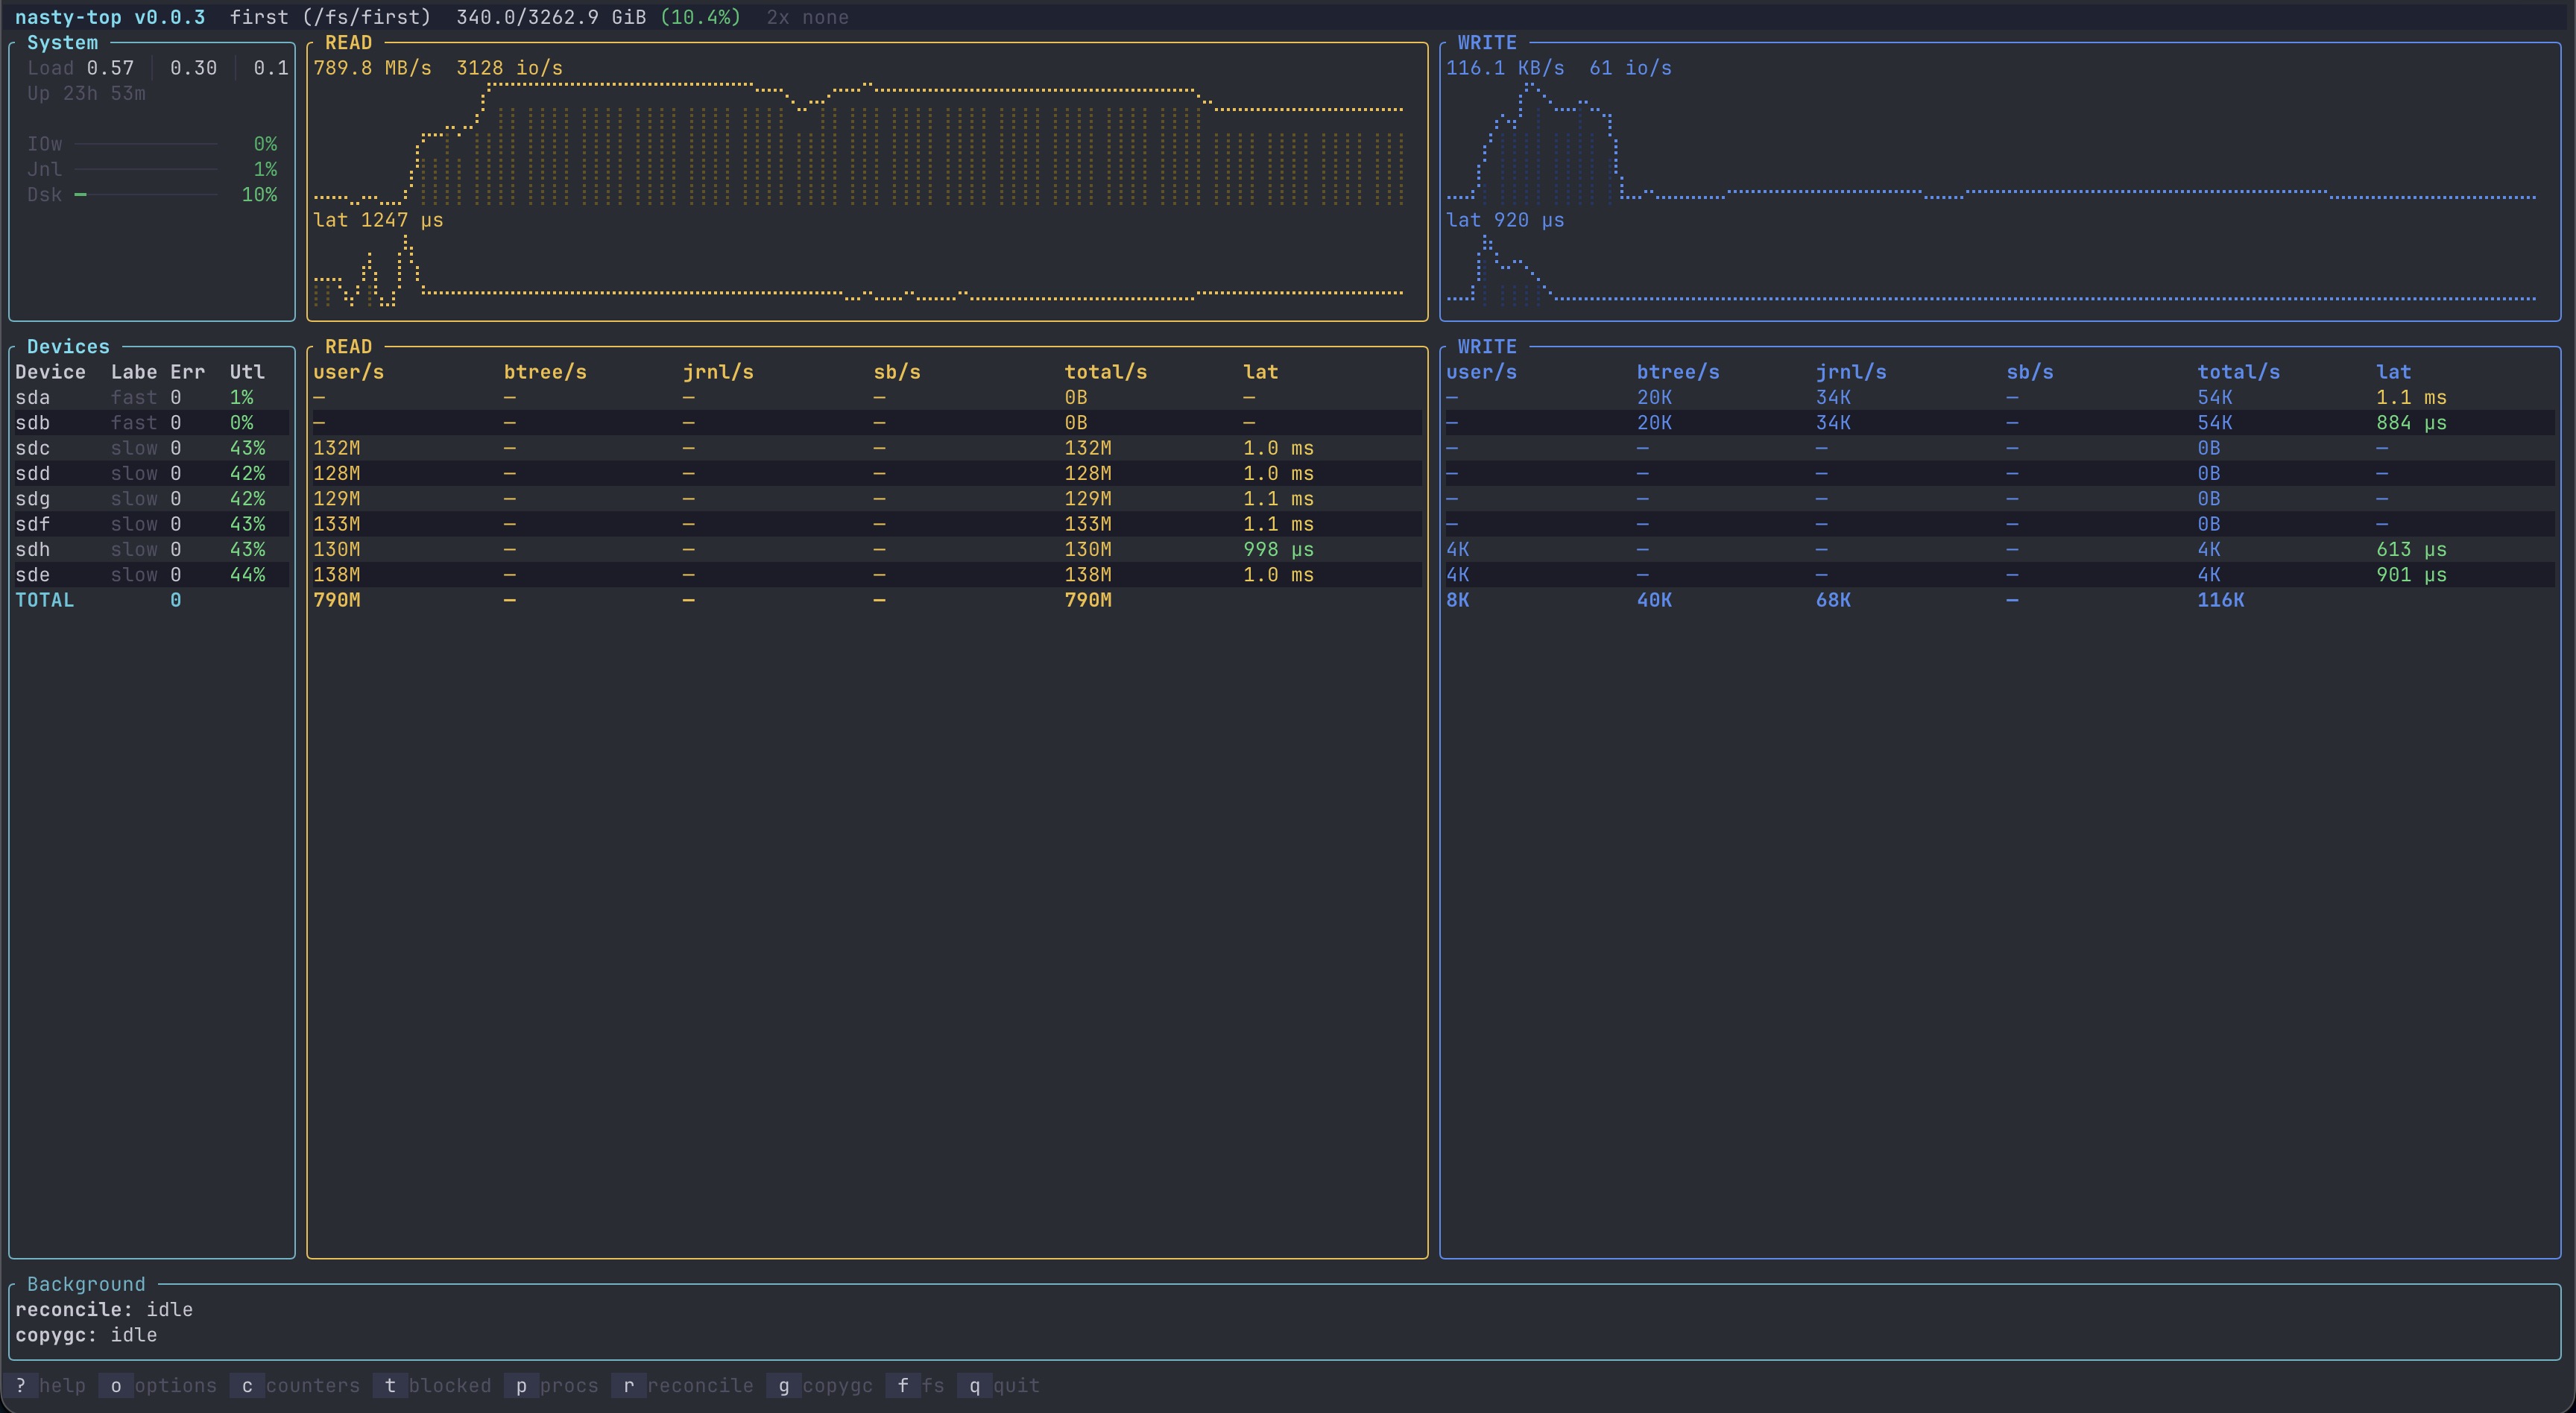
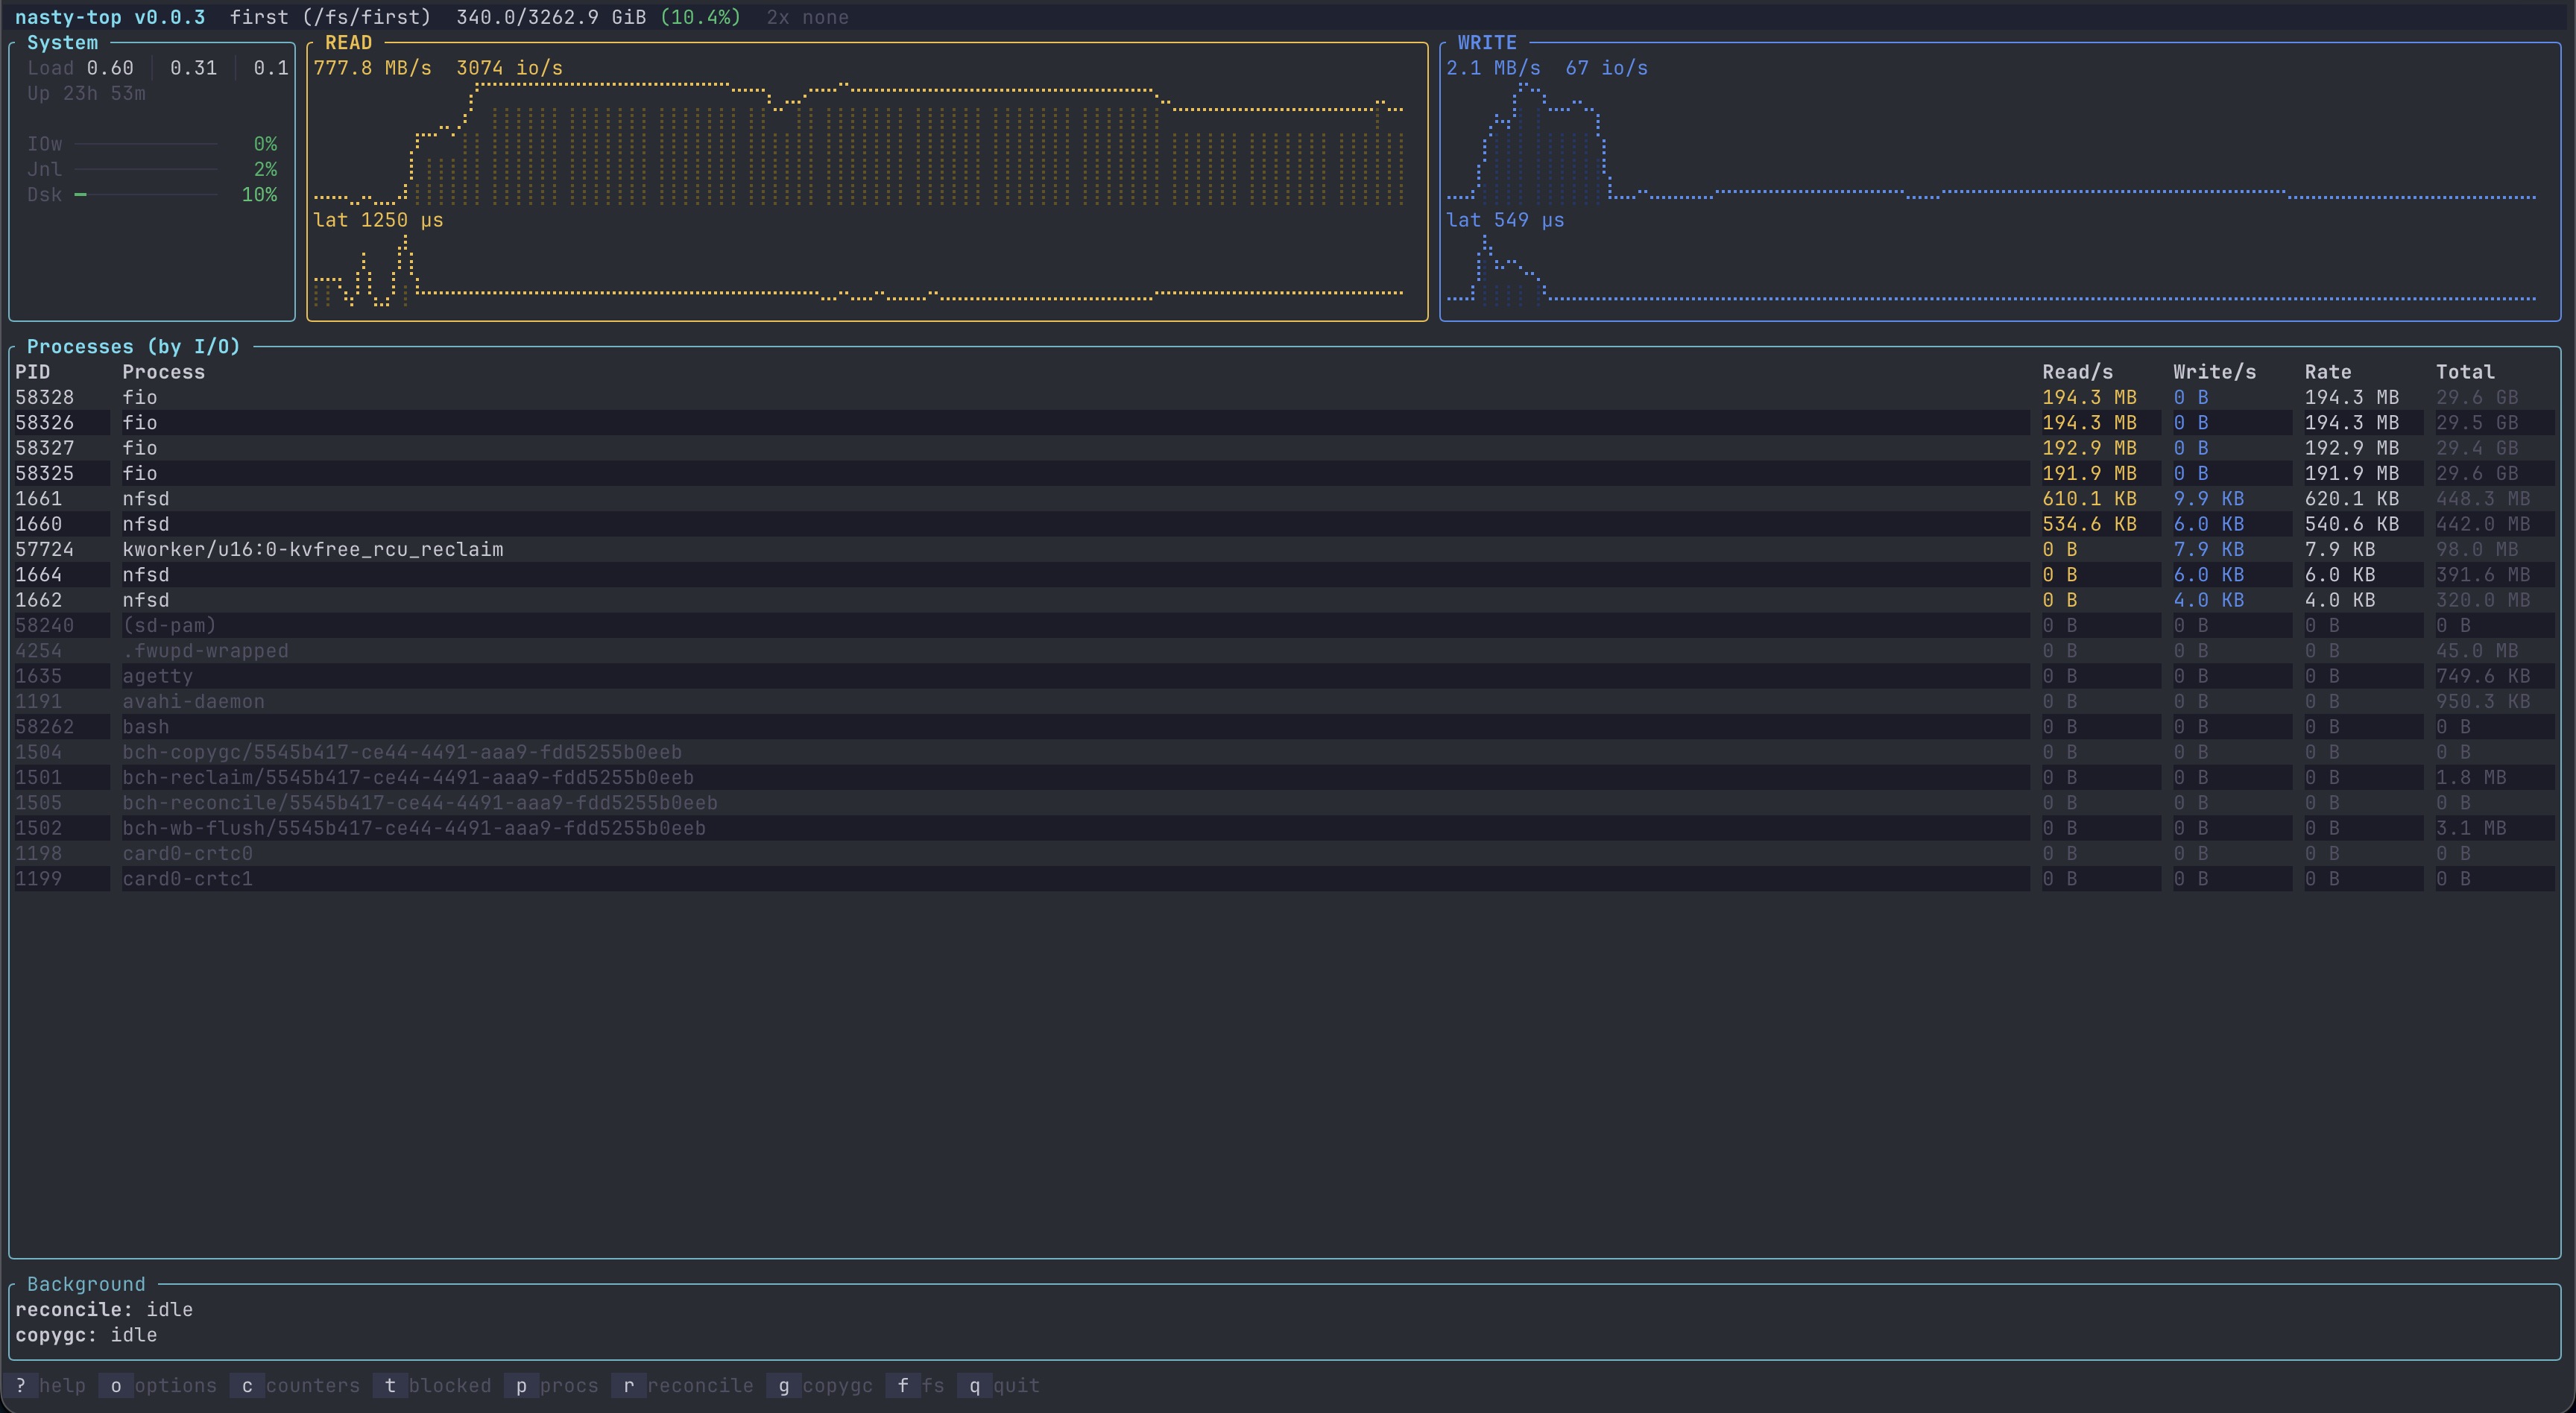
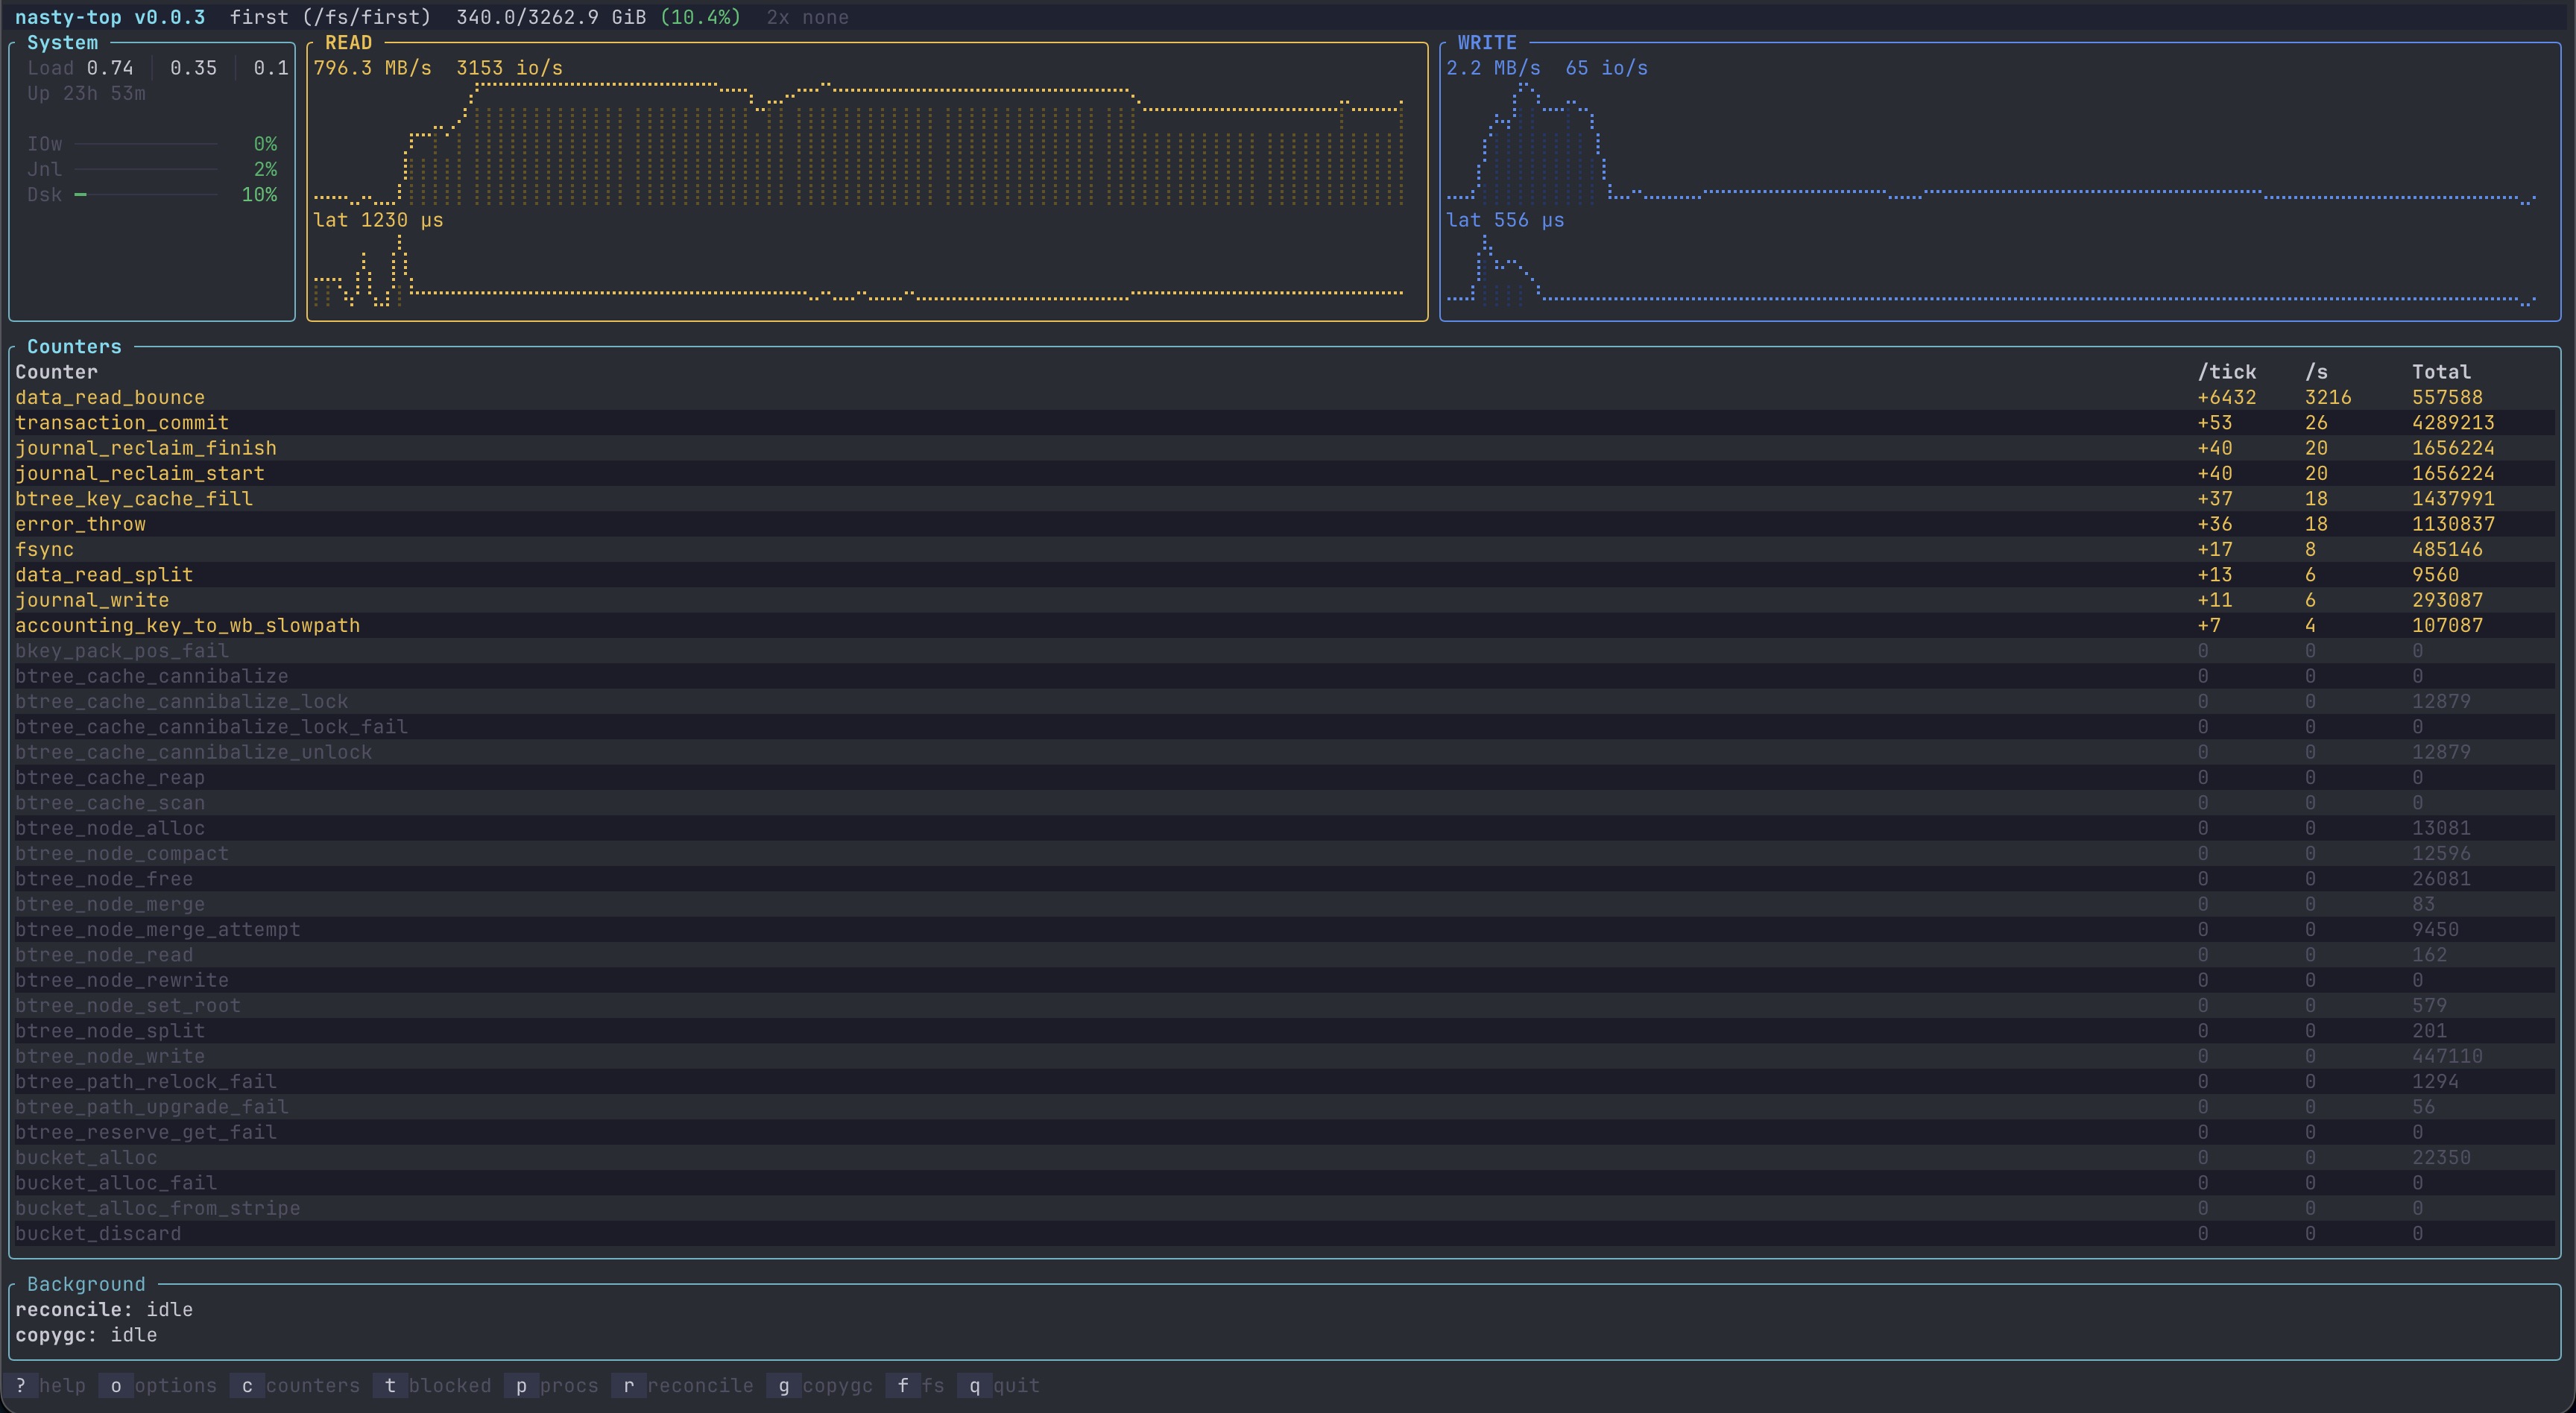
- Live IO throughput and latency per device with user/btree/journal/sb breakdown
- Latency from bcachefs time_stats (EWMA rolling mean, not useless cumulative averages)
- Per-device IO breakdown using
io_doneJSON andio_latency_stats_*_json - Per-device queue diagnostics with current/average queue depth, IOPS, block await, utilization, and pressure outlier highlighting
- Large-pool navigation with synchronized device-table scrolling and worst-pressure-first sorting
- Blocked stats view showing what's actually blocking IO right now (allocator, journal, write buffer, etc.)
- Stall detection with 60-second event log when latency exceeds 200ms
- Evidence-based advisor (
a) with time-windowed I/O, journal and device-health findings, supporting measurements, and investigation guidance - Explain any hint (
w) with the exact rule/equation and captured indicators, including thresholds and unavailable inputs - Options panel with inline editing of runtime-tunable sysfs options
- Multi-filesystem support — press
fto cycle between mounted bcachefs filesystems - Process IO view showing which processes are doing IO
- Journal fill %, load average, reconcile progress
- Memory pressure context with host RAM, available RAM, kernel-reclaimable memory, and the selected filesystem's btree-node cache
- Target capacity / GC pressure view (
v) with eligible members, raw capacity, free buckets, metadata footprint/backlog, and per-member allocation details - Metadata placement diagnostics for oversized footprints, insufficient replica members, and unequal-size replica-layout constraints; missing metrics remain explicitly unknown
- Outstanding I/O detection after 30 seconds without observed completions, including discard/flush progress where available
- Journal bottleneck classification distinguishing space, completion, pipeline, metadata-reclaim and write-buffer pressure
- Active error and member-state alerts with separate error categories, UUID-based histories, recovery/stale states, and multi-device error correlation
- Peer-aware latency findings comparing active members in the same target/label and backing-media class, with comparable queues and workload mix
- Target headroom trends showing up to 10 minutes of fresh allocator measurements, GC-pressure context and placement backlog
- Mapped-device topology resolving
dm-*, partitions and other visible block stacks to backing leaves for peer selection, without double-counting their I/O - Session-aware error counts: the device Err column dims pre-existing counts and turns bold red only when errors grow during the current run — so you can tell at a glance whether a number is dead history or actively climbing
- Consistent color scheme: yellow = read, blue = write, red = errors/stalls
- Runtime: Linux with a mounted bcachefs filesystem and readable
/procand/sysinterfaces. nasty-top can be built on macOS for development, but monitoring requires Linux. - bcachefs tools: install your distribution's
bcachefs-toolspackage so thebcachefscommand is onPATH. It supplies reconcile status and the filesystem-usage fallback. Available metrics depend on the running bcachefs module's interfaces. - Permissions: metric availability depends on the user's access to sysfs and process information. Editing runtime options requires permission to write the corresponding sysfs files, usually root.
- Source installation: Rust/Cargo 1.88 or newer and a C linker/toolchain. On Debian/Ubuntu, the linker/toolchain is provided by
build-essential; on Arch Linux, bybase-devel. Prebuilt downloads do not require Rust.
cargo install nasty-top --lockedThis builds the binary from source and installs it into Cargo's binary directory, normally ~/.cargo/bin. Ensure that directory is on PATH. To install this specific release:
cargo install nasty-top --version 0.0.11 --lockedNix:
nix run github:nasty-project/nasty-topHomebrew (Linux):
brew install fenio/tap/nasty-topDownload binary:
curl -sL https://github.com/nasty-project/nasty-top/releases/latest/download/nasty-top-x86_64-linux.tar.gz | \
  sudo tar xzf - -C /usr/local/bin/
Build from source:
cargo install --path .
# or cross-compile from macOS:
brew install filosottile/musl-cross/musl-cross
rustup target add x86_64-unknown-linux-musl
./deploy.sh root@your-nasnasty-top [OPTIONS]
Options:
-f, --filesystem <NAME|UUID> Filesystem to monitor (default: first found)
-t, --interval <SECONDS> Refresh interval (default: 2)
-h, --help Print help
| Key | Action |
|---|---|
? |
Toggle help popup |
o |
Toggle options panel (hidden by default) |
c |
Toggle counters view |
t |
Toggle blocked stats / time_stats view |
p |
Toggle process IO view |
v |
Toggle target capacity / GC pressure view |
a |
Toggle Advisor findings and evidence view |
w |
Explain the current hint: captured rule/equation and indicators |
s |
Toggle pressure / filesystem device ordering |
r |
Toggle reconcile on/off |
g |
Toggle copygc on/off |
f |
Cycle between filesystems |
Tab |
Switch focus between metrics and options panel |
↑/k, ↓/j |
Scroll devices or the active detail view (including Targets and Advisor) |
Enter |
Edit selected option value (in options panel) |
Esc |
Cancel edit / dismiss status message |
N |
Mute current hint for 2 minutes |
! |
Never show this hint again |
C |
Clear all permanent mutes |
q / Ctrl-C |
Quit |
In the Why this hint? view, ↑/↓ or j/k scroll, PgUp/PgDn move ten lines, Home returns to the top, and w/Esc close the view. The explanation is a frozen copy of the selected hint; monitoring continues, but a new tick cannot replace the inputs you are reading.
| Column / marker | Meaning |
|---|---|
! before a device name |
The performance-pressure heuristic flagged the device based on queueing, latency or utilization. This is not an I/O error or a declaration that the disk failed. |
Device |
Kernel block-device name of the filesystem member, including sdX, nvme…, and dm-N devices. |
Label |
The member's bcachefs device/group label. |
Err |
Available bcachefs device-error counters. Pre-existing totals are dim; increases during this run are highlighted. ? means the counters could not be read or parsed, not zero errors. |
Utl |
Block-layer busy time as a percentage of the sample interval. It is not a reliable measure of remaining throughput, particularly for parallel SSDs and stacked devices. |
Q |
Instantaneous queue depth: requests outstanding when sampled. |
AQ |
Average queue depth during the interval: change in weighted I/O milliseconds divided by interval milliseconds. This is a number of outstanding requests, not a percentage or a latency. |
IOPS |
Completed read/write requests per second during the interval. |
await |
Average block-layer completion time for reads/writes during the interval, in milliseconds. |
bcLat |
bcachefs-reported per-device latency, with displayed units. Uses recent EWMA where exposed; older modules may use a cumulative-mean fallback. |
user/s, btree/s, jrnl/s, sb/s |
bcachefs I/O bytes per second by data type. |
total/s |
Total bcachefs I/O bytes per second for that direction. |
For example, Q = —, AQ = 35.2 can mean that an average of roughly 35 requests were outstanding during the interval, but all had completed by the final sample. Small nonzero averages can round to 0.0. A dash generally denotes zero/inactive activity; some unavailable metrics also use a dash.
Statistics describe the member layer shown. For dm-15, Q/AQ/await/utilization come from dm-15, not directly from the physical disks below it. Device-mapper members are supported; backing-device counters are not automatically added to their totals. Reads served from RAM do not create block I/O, so an active application need not produce device read throughput.
The ! marker includes immediate comparable-peer latency deviations and direct queue/busy-time pressure. Advisor latency findings require the peer deviation to persist for 30 seconds. If peer context is unavailable, the tool can still highlight a large queue without asserting that the device is unusually slow relative to peers.
Press a for the peer group, read/write comparisons, supporting AQ measurements and sustained findings. Comparisons keep rotational devices, NVMe and other non-rotational devices separate. At least two peers with non-overlapping kernel-visible backing devices must be active in the same direction with broadly similar queue depth, request rate and read/write mix. Unknown/mixed backing graphs, insufficient peers and idle samples are explicitly unavailable. Earlier comparable non-outlier samples provide an optional request-weighted device baseline.
Press v for per-target headroom history and member backing-device information. Trends use fresh allocator samples, not repeated reads of cached values. They show observed free-bucket changes, sampled GC pressure, and metadata/background placement backlog where applicable. Falling-headroom warnings require at least two minutes of evidence, a material ongoing decline, and GC pressure in at least 80% of samples. Policy/membership changes and missing or stale measurements restart the history. These are measured trends, not time-until-full forecasts; see TUNING_RULES.md for thresholds and limits.
| Metric | Source | Notes |
|---|---|---|
| IO throughput | dev-N/io_done (JSON) |
Per-type breakdown, diffed per tick |
| IO latency (device) | dev-N/io_latency_stats_{r,w}_json |
EWMA mean, shown only when active |
| Queue depth / await / IOPS / utilization | /proc/diskstats |
Read once per tick, with a common monotonic timestamp; optional discard and flush completion counters |
| IO latency (fs) | time_stats/data_{read,write} |
"recent" column rolling mean |
| Blocked stats | time_stats/blocked_* |
Count delta per tick + recent mean |
Journal entry occupancy (JEnt) |
internal/journal_debug |
Dirty/total entries, watermark and sequence positions; not disk journal-space usage; ? when unavailable |
| Device error categories | dev-N/io_errors |
Lifetime section only, without double-counting the since-reset section |
| Member identity / state | dev-N/{uuid,state,block} |
UUID preferred; index/name fallback; state transitions and online status |
| Backing topology / media | /sys/class/block/*/{slaves,partition,queue/rotational} |
Resolve visible dm/partition stacks; incomplete or mixed graphs are unknown for peer comparison |
| Btree-node cache | btree_cache_size |
Kernel-reported main buffers; approximate and not total bcachefs RAM |
| Host memory | /proc/meminfo |
Used, available, and kernel-reclaimable memory |
| Reconcile | bcachefs reconcile status |
Subprocess, parsed for progress |
| Reconcile backlog | Same status output | Data and metadata columns retained separately |
| Target membership / eligibility | options/*_target, dev-N/{label,state,durability,data_allowed,block} |
Hierarchical labels or resolved device paths; non-writable/ineligible members excluded |
| Member capacity / allocation | dev-N/{nbuckets,bucket_size,alloc_debug} |
Member capacity, free buckets, btree and fragmented bytes; refreshed every 10s or on observed membership/state/options changes |
| On-disk metadata footprint | internal/alloc_debug |
Btree sectors converted to bytes; already includes physical replicas |
| GC pressure | internal/copy_gc_wait |
Running state and sign of each member's calculated wait; refreshed each tick |
| Process IO | /proc/<pid>/io |
read_bytes/write_bytes diffed |
| Options | options/* |
Read/write directly to sysfs |
Press w on any footer hint to see why it was proposed. Every finding carries a Rule / equation and an Indicators used list. The same explanation appears inline in Advisor (a), and target findings also include it in Targets (v). Rules include their thresholds, gates and assumptions; indicators include the measured values and source context. Unknown inputs remain explicitly unknown. Context-only data, such as a backlog that is not a trigger condition, is labelled separately.
For example, a metadata-capacity hint shows:
Rule / equation:
  P > C
  P = accounted physical btree sectors * 512 (already replicated)
  C = SUM(raw capacity of eligible target members)
Indicators used:
  Eligibility, state, durability and capacity for each member
  P and C in bytes, plus the computed shortfall
GC hints show the kernel's raw calculated-wait value and the <= 0 criterion. Peer-latency hints show the peer-selection filters, selected peers' measurements, computed latency threshold, duration and observation count. Headroom hints show each term of the decline/GC-pressure equation. Journal hints show classification order and all considered blocking/latency signals, including unavailable ones. Floating-point values are rounded for display.
Resolved/stale findings retain the criteria and inputs from their last active observation rather than recomputing an explanation from unrelated current measurements.
When a constraint or pressure signal fires, a hint appears in the footer. Press a for all findings, evidence, first/last observation times, and active/resolved/stale status; v shows target capacity details. Observed events are distinguished from possible causes. Muting one hint reveals the next eligible hint; dismissals are scoped to the filesystem for the current run and do not hide evidence from the detail views.
The advisor uses up to 60 seconds of valid, timestamped evidence. Missing samples, counter resets, device replacement, and long collection gaps break continuity instead of producing false spikes or extended stall durations. Slow EWMA values only contribute to journal diagnoses when the corresponding operation count advances. The old blanket recommendations to flush more often or increase reserves have been replaced with investigation guidance.
For example, a metadata target with 2.82 TiB of eligible member capacity and a reported 3.64 TiB physical btree footprint is flagged, together with its metadata-placement backlog. The view also names members whose kernel GC-pressure signal is non-positive. It reports constraints rather than claiming to prove a reconcile deadlock.
Raw capacity is an upper bound before reserves, journals and other data. Free buckets are not guaranteed allocatable space (cached/fragmented space is different). Targets are best-effort, may overlap, and data-target options are filesystem defaults, not a survey of per-file overrides. Unknown/unsupported sysfs formats display ?; they do not imply zero capacity. See TUNING_RULES.md for the rules and estimation limits.
Pushing a v* tag runs .github/workflows/release.yml. The workflow first checks that the tag, Cargo.toml, and the root package in Cargo.lock have matching versions. It then builds the Linux binaries, creates the GitHub release, and publishes the source crate to crates.io. Already-published crate versions are skipped on reruns; registry errors fail the check rather than being treated as an unpublished version.
Version 0.0.11 was published manually. To enable automated publishing of subsequent versions, a crate owner must open nasty-top settings, select Trusted Publishing, and add a GitHub publisher with:
- Repository owner:
nasty-project - Repository name:
nasty-top - Workflow filename:
release.yml - Environment: leave empty (the publishing job does not declare an environment)
The job uses rust-lang/crates-io-auth-action@v1 and GitHub OIDC to obtain a short-lived publishing token. A long-lived crates.io API token does not need to be stored in GitHub secrets. Automated publication will only work after the publisher is configured on crates.io and this workflow is included in the tagged commit.
For each subsequent release, update both Cargo version entries, commit the changes, and push the matching tag. CI runs release-metadata tests and verifies that the packaged crate builds before changes are merged.
GPL-3.0-only